

Are you looking for an ultimate solution to measure and optimize your Shopify store’s results, like conversion tracking and an overview of all the payments, actual profits, liabilities, and sales? Also, usually get confused with mixed data and fail to emerge with a sound decision. Well, no need to fret anymore.
Shopify arrives with in-built analytics and reports that facilitate users to review their store’s activities, get their visitors’ insights, analyze their online store speed, and analyze their online store’s transactions.
Using Shopify pre-built reports, you can strengthen your decision with on-demand data. It doesn’t demand any prior setup to provide reliable data that assists in scaling businesses faster. Also, whatever data you want, you can get it in one spot. So, time to dive deeper and stay closer to your store data.
In this post, we will discuss Shopify Analytics and Reports, the types of Shopify reports, how to analyze them, and more.
Let’s get started!
Shopify Analytics and Reports – An Understanding
Shopify analytics and reports is best at identifying top sales trends and sellers that boost the business’s revenue annually. This built-in dashboard allows companies to:
- Compare their store data across the competitive landscape and discover impactful growth opportunities to stay ahead of the pack.
- Evaluate their performance across varied marketing channels by tracking orders, sessions, average order value, conversion rate, first-time consumers, and sales.
- Understand their customers’ behavior and crop up with their engagement factors and edges where they lose the most.
Why Invest in Shopify Analytics & Reports
| Benefits of Shopify Analytics & Reports | |
|---|---|
| Benchmarking | Identify rooms for improvement by comparing the company’s performance against the competitors and industry standards. |
| Third-party Tools Integration | Let the brands integrate other useful 3rd-party tools and apps to get a more comprehensive data analysis from multiple sources. |
| Cohort Analysis | Based on the traits and timeframes, Shopify Analytics and Reports help analyze customer groups to learn the retention rates, lifetime value, and marketing effectiveness. |
| Trend Analysis | Identify the seasonal sales trends and patterns to understand customer behavior to plan promotions, inventory, and marketing campaigns accordingly and effectively. |
| Financial Reporting | Allow users to access financial reports to check profit margins, revenue, and cost analysis for cost management, pricing, and profitability decisions. |
| App & Channel Performance | Evaluate different channels’ performance to identify which is more valuable and allocate the resources effectively. |
| Data Visualization | Provide captivating and visually engaging data visualizations in charts and graphs to let users identify trends, get complex data, and communicate insights. |
| Mobile Performance Tracking | Helps track mobile traffic, their behavior, and conversions to catch up with better optimization of the mobile shopping experience. |
| Abandoned Cart Analysis | Ease abandoned cart analysis to pluck out the issues or blockages in the checkout process and facilitate the best strategy implementation to recover the lost sales. |
| Marketing Campaign Evaluation | Track the marketing campaign’s effectiveness, evaluate advertising channels’ ROI, and identify the most profitable marketing channels. |
| Customer Behavior Analysis | Understand customers’ buying patterns, preferences, and demographics to filter marketing approaches and improve customer satisfaction. |
| Performance Tracking | Observe and track key performance indicators (KPIs) in real-time to find areas of improvement and measure overall performance. |
| Product & Inventory Analysis | Examine product performance and make sound data-driven decisions considering inventory management, avoiding stockouts, and optimizing stock levels. |
| Customizable Reports | Facilitate report customization, meeting specific requirements, data ranges, metrics, and segments to line up with priorities and goals. |
| Data-driven Insights | Get valuable insights into sales performance, customer behavior, and site traffic that help make informed decisions ahead. |
Types of Shopify Reports
Now, there’s no need to stare down overwhelming data while you open up your analytics, as Shopify reports are there for you to break down into varied types of reports. Thus, you pick the one you are aiming at from any of the below:
1. Customer Reports
Whichever plan you hold to run your store among Shopify Plus, or Advanced Shopify, you get access to your customers’ detailed report, including their average order totals, average order count, and predicted purchase value.
The below reports will help you get your customers’ insights:
- First-time vs. returning customer sales
- Returning Customers
- Customer cohort analysis
- Customers over time
- Customers by location
- One-time customers
- Predicted spend tier
Shopify store owners with Shopify Plus or Advanced Plan get access to the following reports also:
- Loyal customers
- At-risk customers
The data that customer reports showcase is completely based on the new customers’ (in the report) order history, despite only the orders placed during your chosen timeframe.
You will witness up-to-date data whenever you open the First-time vs. returning customer sales report. For newer data. you need to refresh or reopen the report.
Steps to Access Your Customer Reports
1. Desktop
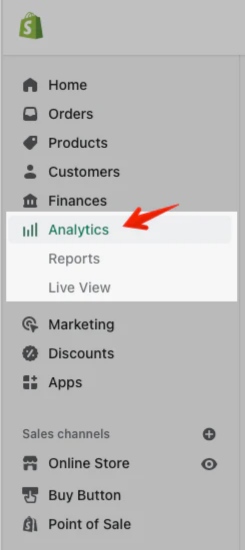
- From your Shopify admin, go to Analytics > Reports.
- Click Categories.
- Click Customers, which will show only customer reports after filtering the reports.
2. iPhone
- From the Shopify app, tap Store, then Analytics.
- Tap Reports.
- Click Categories, then Click Customers, which will show you only customer reports, post-filtering the reports.
3. Android
- From the Shopify app, tap Store, then Analytics.
- Tap Reports.
- Click Categories, then Click Customers, which will show you only customer reports, post-filtering the reports.
2. Behavior Reports
If you are looking to understand your consumers’ shopping behavior, you can consider behavior reports. If your store is running on any higher or other Shopify plan, you get access to the Online store cart analysis report.
Instances of the information you will get reading this report:
- Online store cart analysis
- Product recommendation conversions over time
- Sessions by device
- Online store conversion over time
- Sessions by landing page
- Online store speed
- Top online store searches
Using these insights, you can perform the below actions:
- Upsell to your top target audience.
- Boost your average order value.
- Market your products better offline and online.
- Create product bundles and promotional pricing.
You can use the behavior report data to accordingly arrange your store to ease customers get what they need. This way, they become motivated to make more purchases and boost their sales.
Steps to Access Your Behavior Reports
1. Desktop
- From your Shopify admin, go to Analytics > Reports.
- Click Categories.
- Click Behavior, which will show only behavior reports after filtering the reports.
2. iPhone
- From the Shopify app, tap Store, then Analytics.
- Tap Reports.
- Click Categories, then click Behavior, which will show only behavior reports, post-filtering the reports.
3. Android
- From the Shopify app, tap Store, then Analytics.
- Tap Reports.
- Click Categories, then click Behavior, which will show only behavior reports, post-filtering the reports.
3. Inventory Reports
Your inventory’s month-end snapshot can be available in inventory reports that help track quality and per-day sold inventory percentage. In reports, the insights take 12-72 hours to reflect before you make any inventory changes.
Instances of the information you will get reading this report:
- Average inventory sold per day
- ABC analysis by product
- Days of inventory remaining
- Month-end inventory snapshot
- Percent of inventory sold
- Product sell-through rate
Steps to View Your Inventory Reports
1. Desktop
- From Shopify Admin, go to Analytics > Reports.
- Click Categories.
- To get only inventory reports, click Inventory, which will filter the report.
2. iPhone
- From the Shopify app, tap Store, then Analytics.
- Tap Reports.
- Click Categories, then click Inventory which will show you only inventory reports, post-filtering the reports.
3. Android
- From the Shopify app, tap Store, then Analytics.
- Tap Reports.
- Click Categories, then click Inventory which will show you only inventory reports, post-filtering the reports.
4. Order Reports
This report offers insights into your order fulfillment, volume, delivery, returns, and shipping. You can predict the best-sellers products and which are lagging.
Order reports assist in understanding your customer satisfaction or discovering your defective merchandise.
Instances of the information you will get reading this report:
- Fulfillment, shipping, and delivery times
- Orders over time
- Fulfillment over time
Steps to View Your Order Reports
1. Desktop
- From Shopify Admin, go to Analytics > Reports.
- Click Categories.
- To get only order reports, click Order, which will filter the report.
- Compare data (optional).
2. iPhone
- From the Shopify app, tap Store, then Analytics.
- Tap Reports.
- Click Categories, then click Orders which will show you only order reports, post-filtering the reports.
- Compare data (optional).
3. Android
- From the Shopify app, tap Store, then Analytics.
- Tap Reports.
- Click Categories, then click Orders which will show you only order reports, post-filtering the reports.
- Compare data (optional).
5. Acquisition Reports
Using acquisition reports, you get the details about how the visitors reach your site.
Instances of the information you will get reading this report:
- Sessions by referrer
- Sessions over time
- Sessions by location.
You need to know that the number of visitors and visits is based on cookies, one identifies the visits’ length, and the other identifies the device (visitor). It states that one visitor may lead to multiple visits also.
A visit lasts up to 30 minutes of no activity and ends up automatically. Data gets refreshed within a few minutes. Still, if you cannot see the latest information, try refreshing or re-opening the report.
Steps to View Your Acquisition Reports
1. Desktop
- From Shopify Admin, go to Analytics > Reports.
- Click Categories.
- To get only acquisition reports, click Acquisition, which will filter the report.
2. iPhone
- From the Shopify app, tap Store, then Analytics.
- Tap Reports.
- Click Categories, then click Acquisition which will show you only acquisition reports, post-filtering the reports.
3. Android
- From the Shopify app, tap Store, then Analytics.
- Tap Reports.
- Click Categories, then click Acquisition which will show you only acquisition reports, post-filtering the reports.
6. Marketing Reports
You can check the effectiveness of your marketing and know about your conversions using the Marketing reports. Besides, you will learn what’s attracting shoppers to your online store and what’s pushing them to convert into paying customers. Also, the marketing reports unveil from which marketing channels the highest number of customers are coming and who holds the maximum value depending on how they are interacting with your Shopify store. This report provides a summary of details from every Online Store channel order.
This way, you can determine the priority level for your marketing channel and the most effective marketing type.
Instances of the information you will get reading this report:
- Sessions attributed to marketing
- Conversion by last interaction
- Sales attributed to marketing
- Conversion by the first interaction
- Attribution model comparison
Note: The data of the marketing report may take around one day to reflect, so while trying to evaluate the impact of any of your particular marketing campaigns, be sure you wait for at least 24 hours post the campaign ends.
Steps to View Your Marketing Reports
1. Desktop
- From Shopify Admin, go to Analytics > Reports.
- Click Categories.
- To get only marketing reports, click Marketing, which will filter the report.
2. iPhone
- From the Shopify app, tap Store, then Analytics.
- Tap Reports.
- Click Categories, then click Marketing which will show you only marketing reports, post-filtering the reports.
3. Android
- From the Shopify app, tap Store, then Analytics.
- Tap Reports.
- Click Categories, then click Marketing which will show you only marketing reports, post-filtering the reports.

7. Profit Reports
The profit reports uncover the details about your online store’s margins, profit, and costs. While considering accounting, you should be aware of your money flows in and out of your organization.
Instances of the information you will get reading this report:
- Profit by Point of Sale location
- Profit by product variant SKU
- Profit by product
- Considerations for dynamic reporting options
- Discounts and refunds
- Viewing profit reports
- Adding cost per item to your products
Steps to View Your Profit Reports
1. Desktop
- From Shopify Admin, go to Analytics > Reports.
- Click Categories.
- To get only profit margin reports, click Profit Margin to filter the report.
2. iPhone
- From the Shopify app, tap Store, then Analytics.
- Tap Reports.
- Click Categories, then click Profit Margin, which will show you only profit margin reports, post-filtering the reports.
3. Android
- From the Shopify app, tap Store, then Analytics.
- Tap Reports.
- Click Categories, then click Profit Margin, which will show you only profit margin reports, post-filtering the reports.
8. Sales Reports
The sales reports can help you with the details about your customers’ orders on the basis of product, channel, or sales over time. If you are looking at the point-of-sale reports, you can refer to Retail sales reports.
Besides, sales reports take returns into consideration, which assists you in tracking your sales value over a long time period. Data from a sales report takes about one minute to reflect the changes. So, to witness newer data, refresh or reopen the report. Sales will get up-to-date within 12-72 hours in the Sales by Discount report.
Instances of the information you will get reading this report:
- Sales by product
- Sales by product vendor
- Sales by traffic referrer
- Sales by checkout currency
- Sales by customer name
- Sales over time
- Sales by product variant SKU
- Sales by discount
- Sales by billing location
- Sales by channel
- Average order value over time
Note: Shopify stores on the Shopify plan or higher get access to the sales reports.
Steps to View Your Sales Reports
1. Desktop
- From Shopify Admin, go to Analytics > Reports.
- Click Categories.
- To get only sales reports, click Sales, which will filter the report.
2. iPhone
- From the Shopify app, tap Store, then Analytics.
- Tap Reports.
- Click Categories, then click Sales, which will show you only sales reports, post-filtering the reports.
3. Android
- From the Shopify app, tap Store, then Analytics.
- Tap Reports.
- Click Categories, then click Sales, which will show you only sales reports, post-filtering the reports.
9. Retail Sales Reports
The merchants selling in-person need to know the details about their products, staff, or variants specific to their point-of-sale location(s), and they may get this from the Retail Sales Report.
Besides, using this report, you can identify the best-selling products based on areas and get valuable details about your staff members’ sales performance.
Instances of the information you will get reading this report:
- Retail sales by product variant SKU
- Retail sales by product type
- Retail sales by staff at the register
- Retail sales by product
- Retail sales by product vendor
- Retail sales by Point of Sale location
- Retail sales by staff who helped with the sale
Steps to View Your Retail Sales Reports
1. Desktop
- From Shopify Admin, go to Analytics > Reports.
- Click Categories.
- To get only retail sales reports, click Retail Sales, which will filter the report.
2. iPhone
- From the Shopify app, tap Store, then Analytics.
- Tap Reports.
- Click Categories, then click Retail Sales, which will show you only retail sales reports, post-filtering the reports.
3. Android
- From the Shopify app, tap Store, then Analytics.
- Tap Reports.
- Click Categories, then click Retail Sales, which will show you only retail sales reports, post-filtering the reports.
10. Custom Reports
Holding your store on the Shopify Plus or Advanced Shopify plan, you can customize default reports and create custom reports reaping the benefits of the Shopify feature of filtering and editing.
Custom reports are akin to other Shopify reports, just that they use filters to reveal the exact data you want.
To alter a custom report, customize it and then click Save report. Or, you can click Save to build a duplicate custom report with a unique name.
To change a default report, customize it by appending filters and editing the columns, and then click Save as and name it differently.
Your modified or newly created reports are accessible to your staff, and they can even modify and duplicate those reports.
Note: Consider downloading a reporting app from the Shopify app store to filter a custom report based on the tags.
Steps to Create Custom Reports
1. Desktop
- From Shopify Admin, go to Analytics > Reports.
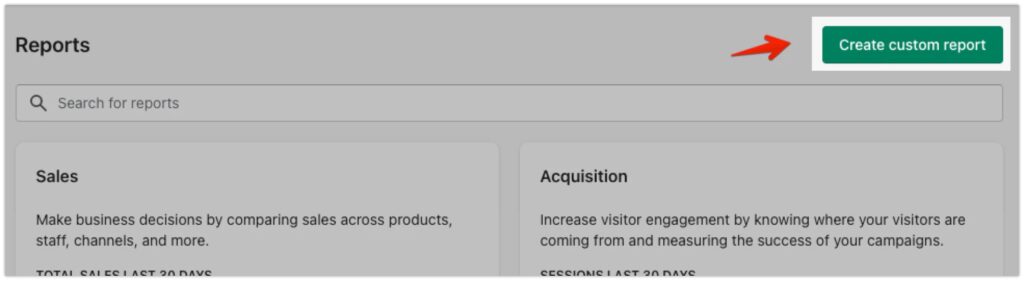
- Click Create custom report.
- From the dialog “Create custom report,” pick the report type that you would like to start creating.
- To give your report a descriptive tag, enter it under the Report title.
- Click Create custom report.
- By filtering and editing, customize your new report.
- Click the Save report when you finish creating the report.
When you filter the list by Authors and then choose Users, you can access your report on the Reports page of your Shopify admin.
2. iPhone
- From the Shopify app, tap Store and then tap Analytics.
- Tap Reports.
- Tap the “+” button.
- From the dialog “Create custom report,” pick the report type that you would like to start creating.
- To give your report a descriptive tag, enter it under the Report title.
- Click Create custom report.
- By filtering and editing, customize your new report.
- Click the Save report when you finish creating the report.
When you filter the list by Authors and then choose Users, you can access your report on the Reports page of your Shopify admin.
3. Android
- From the Shopify app, tap Store and then tap Analytics.
- Tap Reports.
- Tap the “+” button.
- From the dialog “Create custom report,” pick the report type you want to start creating.
- To give your report a descriptive tag, enter it under the Report title.
- Click Create custom report.
- By filtering and editing, customize your new report.
- Click the Save report when you finish creating the report.
When you filter the list by Authors and then choose Users, you can access your report on the Reports page of your Shopify admin.
Shopify Reporting Apps – An Exceptional Reporting Tools Experience
Besides offering exceptional reporting tools, Shopify also facilitates integration with a plethora of 3rd-party reporting apps for merchants who are looking for an advanced set of accounting tools.
In the Shopify app store, you can find the reporting apps that meet your varied requirements, like financial accounting, marketing analytics, and inventory management.
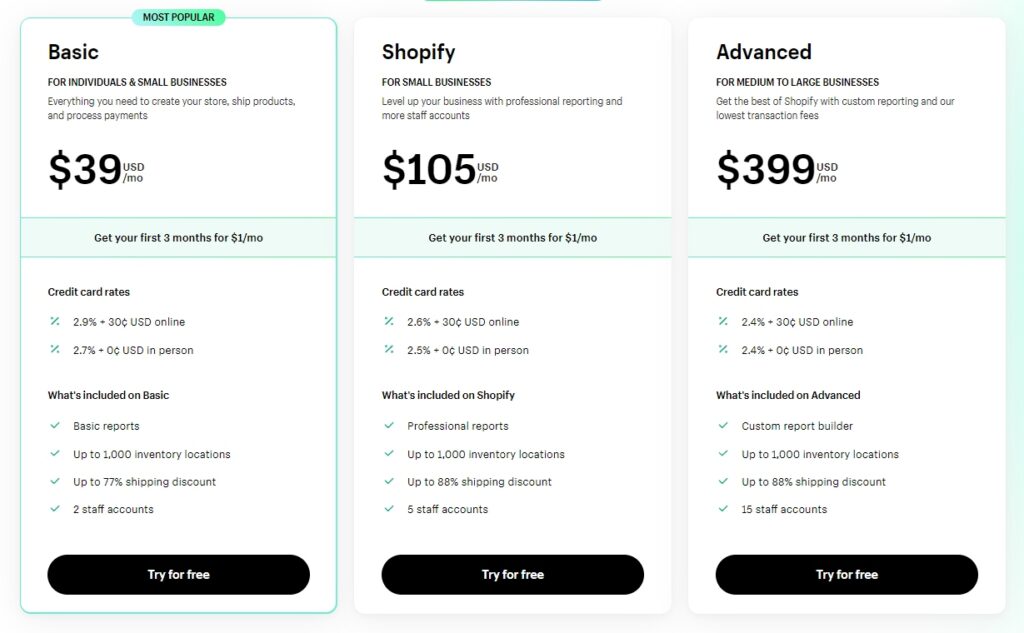
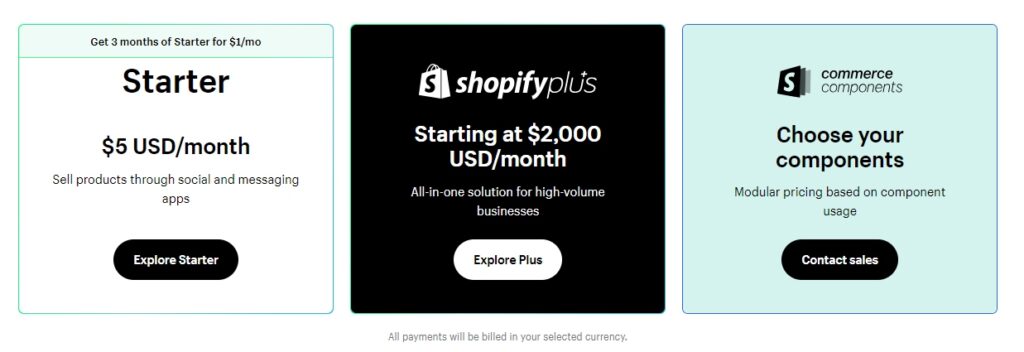
Get Access to Shopify Reports Based on Shopify Subscription Plan You Choose
Access to the types of reports you are looking for depends on your e-commerce store’s Shopify subscription plan. Each plan offers different reports, be sure the plan you pick includes the shopify report types suiting your business needs.
On upgrading to higher plans, you get access to additional reports offering data from the moment you start using Shopify.
| Analytics and Reports | Shopify Lite | Shopify Starter / Basic Shopify | Shopify | Advanced Shopify | Shopify Plus |
|---|---|---|---|---|---|
| Analytics Page | ✓ | ✓ | ✓ | ✓ | ✓ |
| Finances Reports | ✓ | ✓ | ✓ | ✓ | ✓ |
| Product Analytics | ✓ | ✓ | ✓ | ✓ | ✓ |
| Live View | – | ✓ | ✓ | ✓ | ✓ |
| Acquisition Reports | – | ✓ | ✓ | ✓ | ✓ |
| Inventory Reports | – | ✓ (5 of 7) | ✓ | ✓ | ✓ |
| Behavior Reports | – | ✓ (5 of 6) | ✓ | ✓ | ✓ |
| Marketing Reports | – | ✓ (1 of 5) | ✓ | ✓ | ✓ |
| Order Reports | – | – | ✓ | ✓ | ✓ |
| Sales Reports | – | – | ✓ | ✓ | ✓ |
| Retail Sales Reports | – | – | ✓ | ✓ | ✓ |
| Profit Reports | – | – | ✓ | ✓ | ✓ |
| Customer Reports | – | – | ✓ (7 of 9) | ✓ | ✓ |
| Custom Reports | – | – | – | ✓ | ✓ |
How To Analyze Shopify Reports Seamlessly – Reports vs. Analysis
When you find reports not working in your case, Analytics can be the savior here. Uncovering your business’s meaningful insights is what you do in the analysis process. So, basic e-commerce metrics will not only help you uncover the “what” but also the “why” and “so what.”
Comparatively, Analysis is more complicated than reports as it makes you get deeper into the analytics. Also, it may demand more effort but will ensure providing you with something beneficial, like
- The valuable answers to your meaningful business queries.
- Quick fixes and wins to enhance your conversion rate and user experience (UX).
- The problematic areas that are costing you more money unknowingly.
How Can Emizentech Help You?

Being a trusted Shopify partner, Emizentech can help you uncover reports and analytics of whichever department or sections you want for your business, like inventory, sales, orders, customer experience, etc.
Key Highlights
- Provide technical support and help in troubleshooting
- Help set up the Shopify store and configure it.
- Best at monitoring and analyzing online store data.
- Craft and implement best-suitable marketing campaigns and strategies, etc.
Key Takeaways
Post-reading this article, we hope you got answers to all your queries and got out of your confusion relevant to Shopify reports.
Shopify reports are always the most helpful way to slice the data and target specific reports per your business requirements. It arrives with varied types of reports where you can get insights into your different business needs. This way, you can make sound decisions for all your business things and grab your objectives successfully.
Well, if you are not from a technical background, you may need help from skilled Shopify experts to help you with a proper understanding and usage of Shopify reports.
Find a Shopify development company and get assistance from their Shopify consultants!
Frequently Asked Questions FAQs
On Shopify, you can create your reports in your Shopify store and
◉ Go to Analytics > Reports (on the left-side menu).
◉ Select the report (you want to create from the list) OR Click the Create Custom Report button (in the top-left corner).
In the Shopify reports, the data can assist you in spotting your store’s issues and resolving them faster. Using reporting tools, you can understand your products, sales, marketing campaigns, objectives, inventory management, etc., which can let you expand your business by making sound and well-informed decisions.
In Shopify, you will see various reports where you get different types of data relevant to your store. Besides, you can create custom reports to sort and filter your data per your business requirements. You get the details about your store traffic, customer behavior, sales data, inventory data, marketing campaign data, and a lot more.
Yes! You only need to click the Export button (on your screen’s top-right corner) to view any report. You can export the reports as a CSV (comma-separated values) table, which means you can open them in Google Sheets, Excel, and various accounting and spreadsheet software.


 USA
USA UK
UK
